Someone was kind enough to send me an email thanking me for the previous post I created detailing how to create prometheus exporters using golang. While it was great to receive a note, I kind of panicked because I realized that I hadn’t updated that post to reflect a much easier way of creating exporters that I had learned about. This post will hopefully shed some light on the better way. It may still be beneficial to read the previous post if you want some extra context around my initial thoughts on this.

Straight to the Code

No messing around in this post. Creating a basic go program with a /metrics endpoint is pretty straight forward and, in fact, the initial main.go file is unchanged from the previous post.

  • Create a main.go file in the subdirectory of your choice. Paste the following contents:
package main

import (
  "net/http"

  log "github.com/Sirupsen/logrus"
  "github.com/prometheus/client_golang/prometheus/promhttp"
)

func main() {
  //This section will start the HTTP server and expose
  //any metrics on the /metrics endpoint.
  http.Handle("/metrics", promhttp.Handler())
  log.Info("Beginning to serve on port :8080")
  log.Fatal(http.ListenAndServe(":8080", nil))
}

Now, let’s build our metrics. We’ll do this by creating a collector.go file and adding a simple init function to register and seed our metrics with values.

  • Create a new file called collector.go in the same directory.
  • In the file, paste the following code.
package main

import (
	"github.com/prometheus/client_golang/prometheus"
)

//Define the metrics we wish to expose
var fooMetric = prometheus.NewGauge(prometheus.GaugeOpts{
	Name: "foo_metric", Help: "Shows whether a foo has occurred in our cluster"})

var barMetric = prometheus.NewGauge(prometheus.GaugeOpts{
	Name: "bar_metric", Help: "Shows whether a bar has occurred in our cluster"})

func init() {
	//Register metrics with prometheus
	prometheus.MustRegister(fooMetric)
	prometheus.MustRegister(barMetric)

	//Set fooMetric to 1
	fooMetric.Set(0)

	//Set barMetric to 0
	barMetric.Set(1)
}

Once we’ve done that we’re actually already pretty much finished! Note that the init function is a bit of go magic. It’s run automatically before running the main function in your program. In the init function above, we simply register our metrics with the prometheus client and give them an initial value.

  • Hit the /metrics endpoint after starting your webserver with go run main.go collector.go.
$ curl 127.0.0.1:8080/metrics

# HELP bar_metric Shows whether a bar has occurred in our cluster
# TYPE bar_metric gauge
bar_metric 1
# HELP foo_metric Shows whether a foo has occurred in our cluster
# TYPE foo_metric gauge
foo_metric 0
...
...
...

Much quicker! From here, you would likely want to add some functions to your program that updates your metrics based on things occurring during runtime or based on a timer. We won’t cover those here but as you can see, exposing metrics in this way is much easier than implementing the interfaces and whatnot that I was doing in the previous post. Hope this helps folks out!

One of my co-workers introduced me to the idea of lightboards a couple of weeks ago. I had seen them before while watching YouTube tutorials and that kind of thing, but I never realized that they were “open source hardware” and how easy it seemed to be to create one. That said, they still seemed a bit price prohibitive to me, as the builds shown required a monster piece of glass, along with some pretty fancy cameras. Most of the examples are universities that have built them for various purposes. Clemson has a whole lightboard room you can reserve!

However, the same co-worker also linked me to this video, where the lady builds a mini version of the standup lightboard on the cheap. It seems to work pretty well in the video, but I still wasn’t super thrilled about the fact that it required recording and flipping the video after drawing. That problem seemed easily solvable, but I also didn’t really like the real estate that the standup board took up. Cut to me trying to figure out how I can create a flat, desktop version of this that can be used during live video calls. I was able to come up with something workable for about 160 bucks, about 110 if you’ve already got a USB webcam.

Parts List

I needed to buy quite a bit of cheap stuff for this project; however, I had some things at home that would have been super expensive to purchase outright. This is mostly power tools and accessories: a miter saw, electric drill, Kreg jig.

Here’s a basic parts list with links to what I bought.

For the lightboard:

  • 1 1 x 4 Board (8 ft.) - $8.52
  • 4 3/8in x 36in Square Dowels - 4 x $1.14
  • 1 Box 1in Nails - $2.64
  • 1 24in x 18in Plexiglass Sheet (The thickest one they had) - $21.98
  • 1 16ft LED Light Strip - $13.99
  • 1 Expo Neon Markers - $7.21

Total: $58.90

For the camera:

  • 1 Webcam Stand - $18.78
  • 1 Logitech C920 Webcam - $49.99
  • 1 Manycam Lifetime License - $29.00
  • 1 Webcam Settings App - $2.99

Total: $100.76

Grand Total: $159.66

It’s easy to see how you could really save some coin on this if you’ve already got a webcam that fits the stand, which is just a screw-in on the bottom.

Building The Box

Building the box is pretty much just that. Building a box. This step uses up the 1x4 that we bought. Just make sure to follow the “measure twice cut once” mantra. I ended up having to purchase more wood because I wasn’t paying attention. :facepalm:

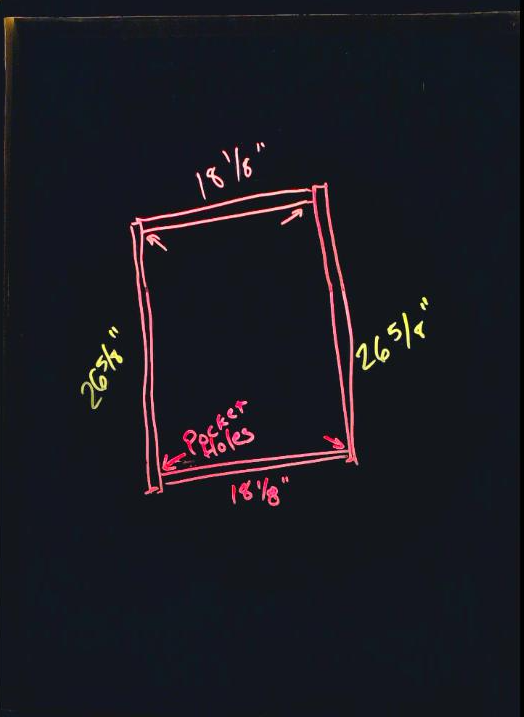
Here’s a diagram of what the base box looked like for me. Notice I had to add 1/8” to the inner dimensions of the box. This is because the plexigrass was actually a bit larger than advertised.

I had a “Kreg jig” that allowed me to drill pocket holes from the shorter pieces of wood into the longer pieces.Here’s a video that shows how that works. The jig isn’t cheap though, so don’t feel like you need to buy it just for this project. If you do other woodworking stuff it’s awesome. I also had some 1 & 1/4” screws that came with the jig that I used for this. I didn’t include them in the cost above, but you can use any screws around that length to join the wood by just screwing straight through and it should be fine.

Once I had the base box built, it was time to create a little shelf for the plexiglass and the LED lights. This is where we’ll use the square dowels we bought. I started by cutting two of them down to 18-1/8” to match the shorter sides of the box. using the 1” nails, I then nailed these in about 1/2” down from what will be the top side of the lightboard.I wish I had taken more pics of this during the build, but here’s the bottom of the finished product where you see how these dowels can be nailed in and butted up against one another on all side.

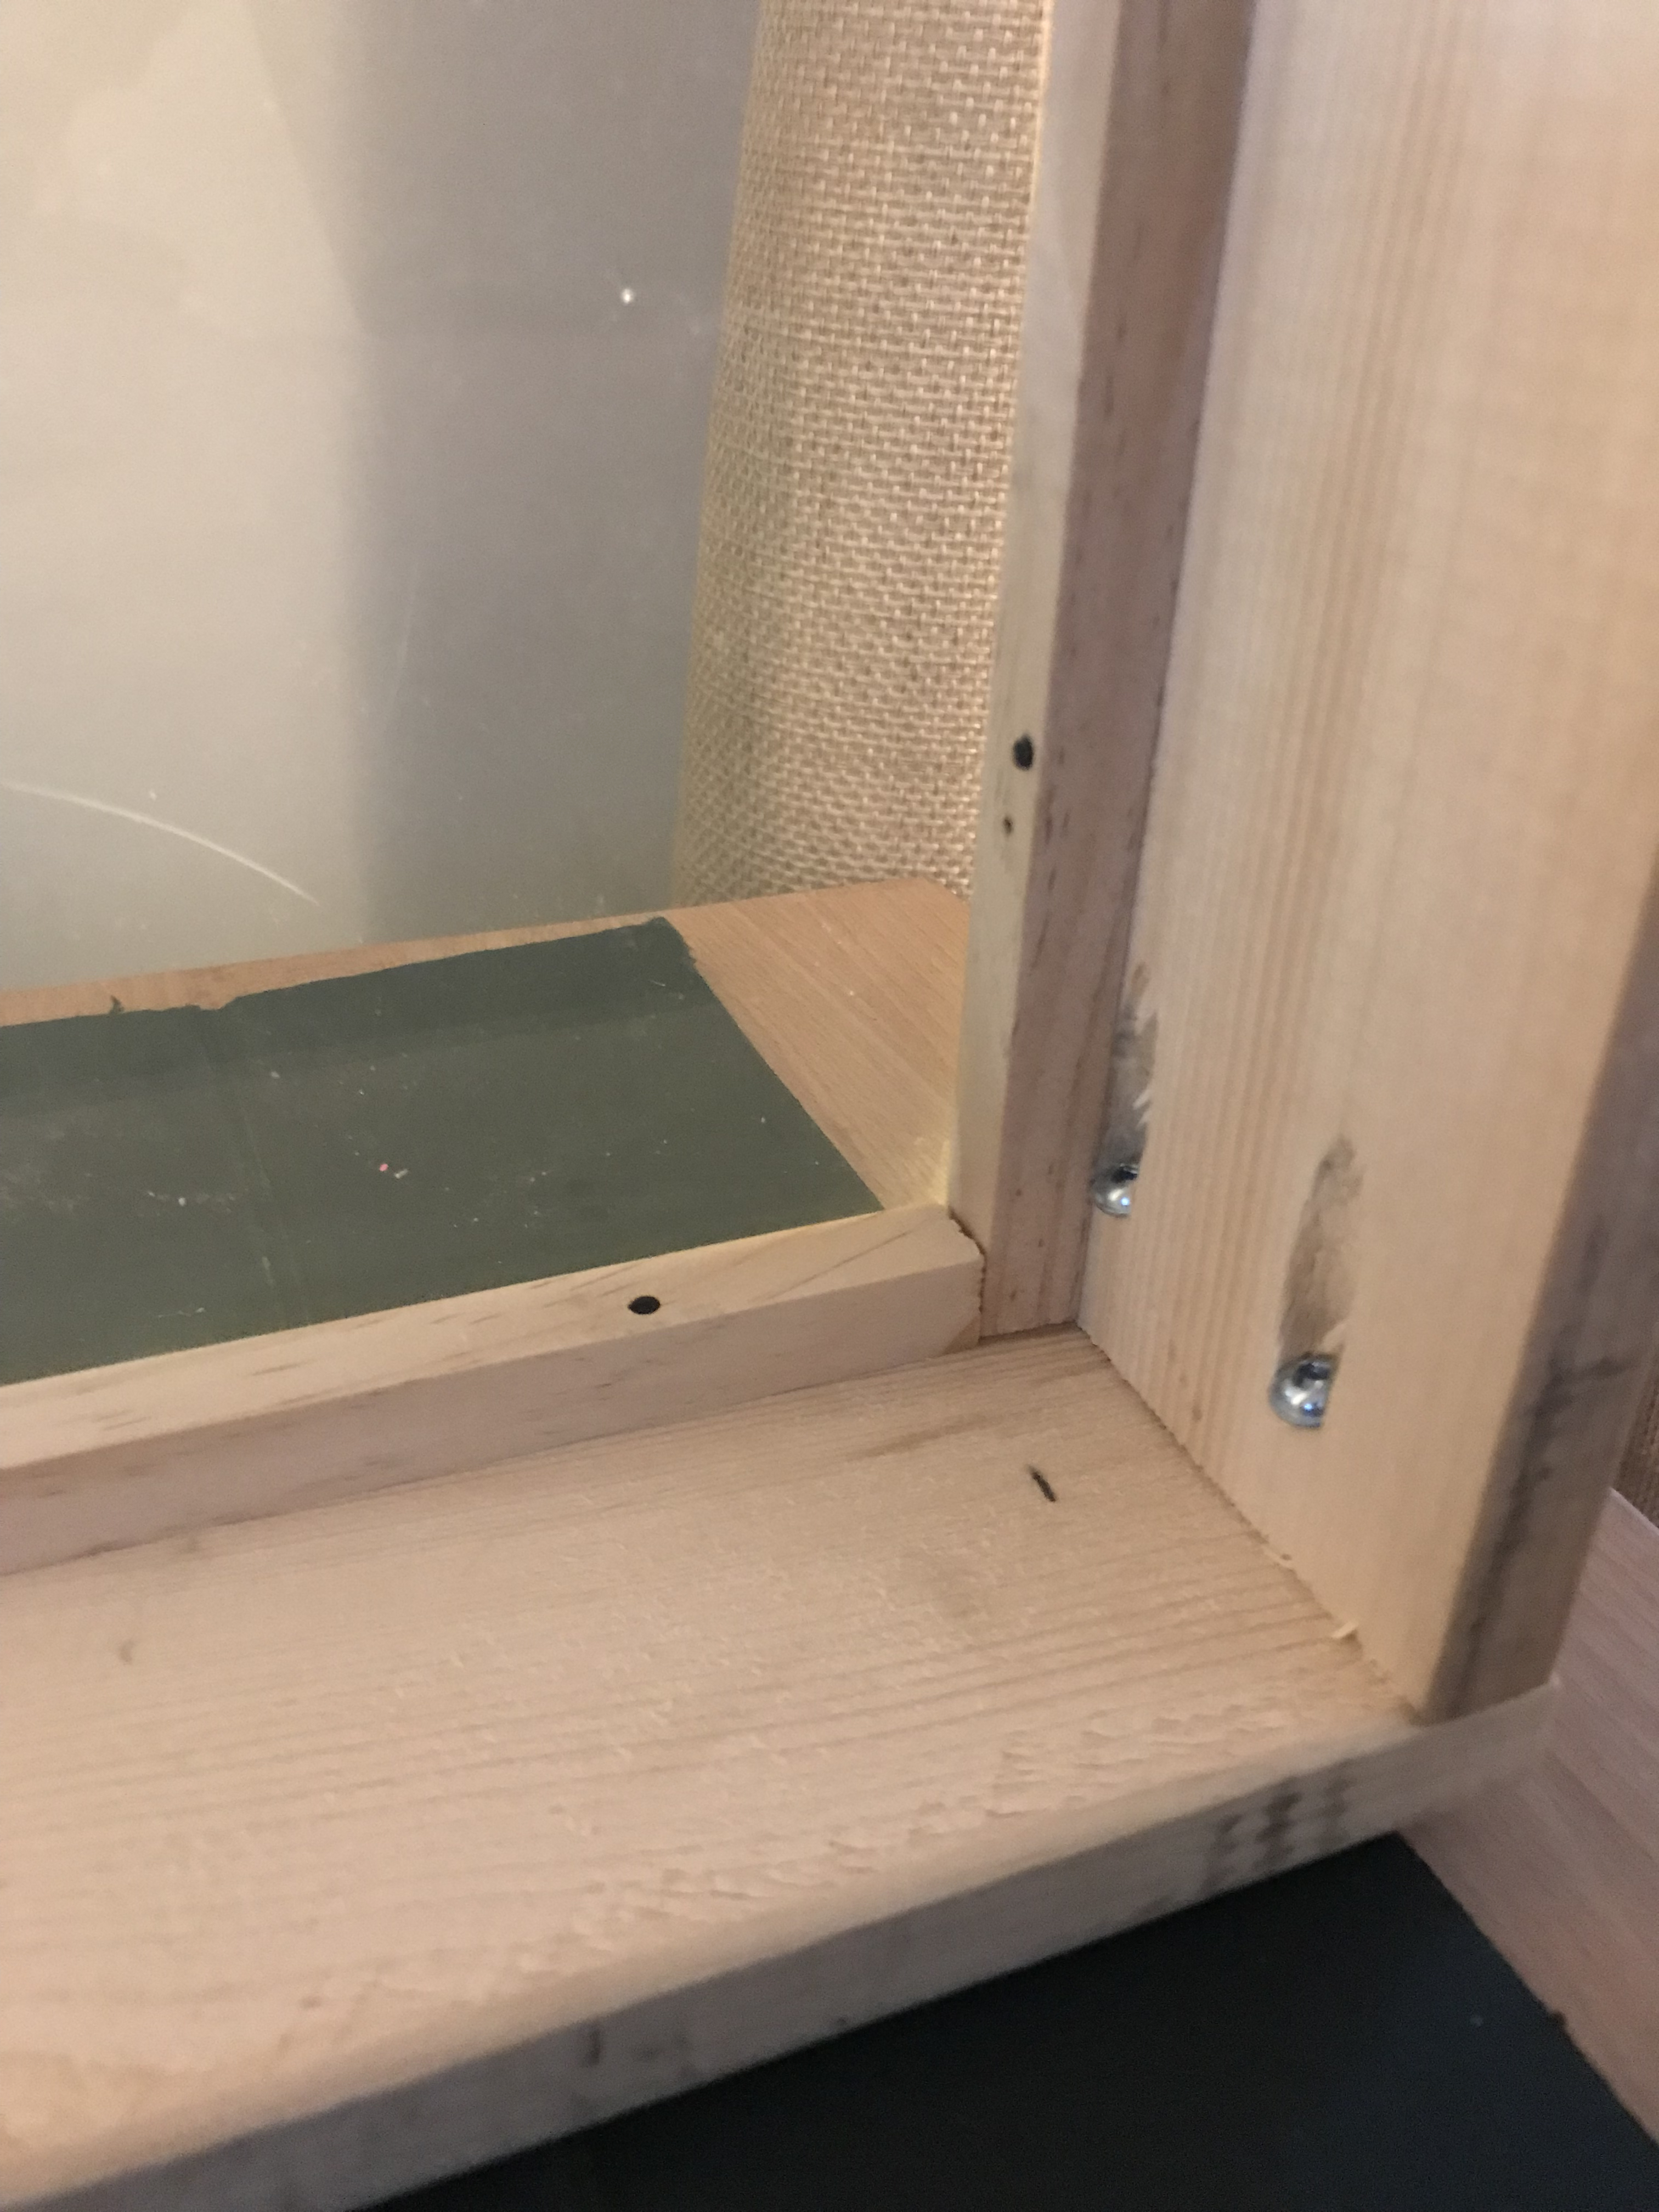
NOTE: On one of the sides, it’s a good idea to cut one of the dowels a bit short. This will allow you to feed the LEDs up into the shelf cavity in the next step. Pic of that here:

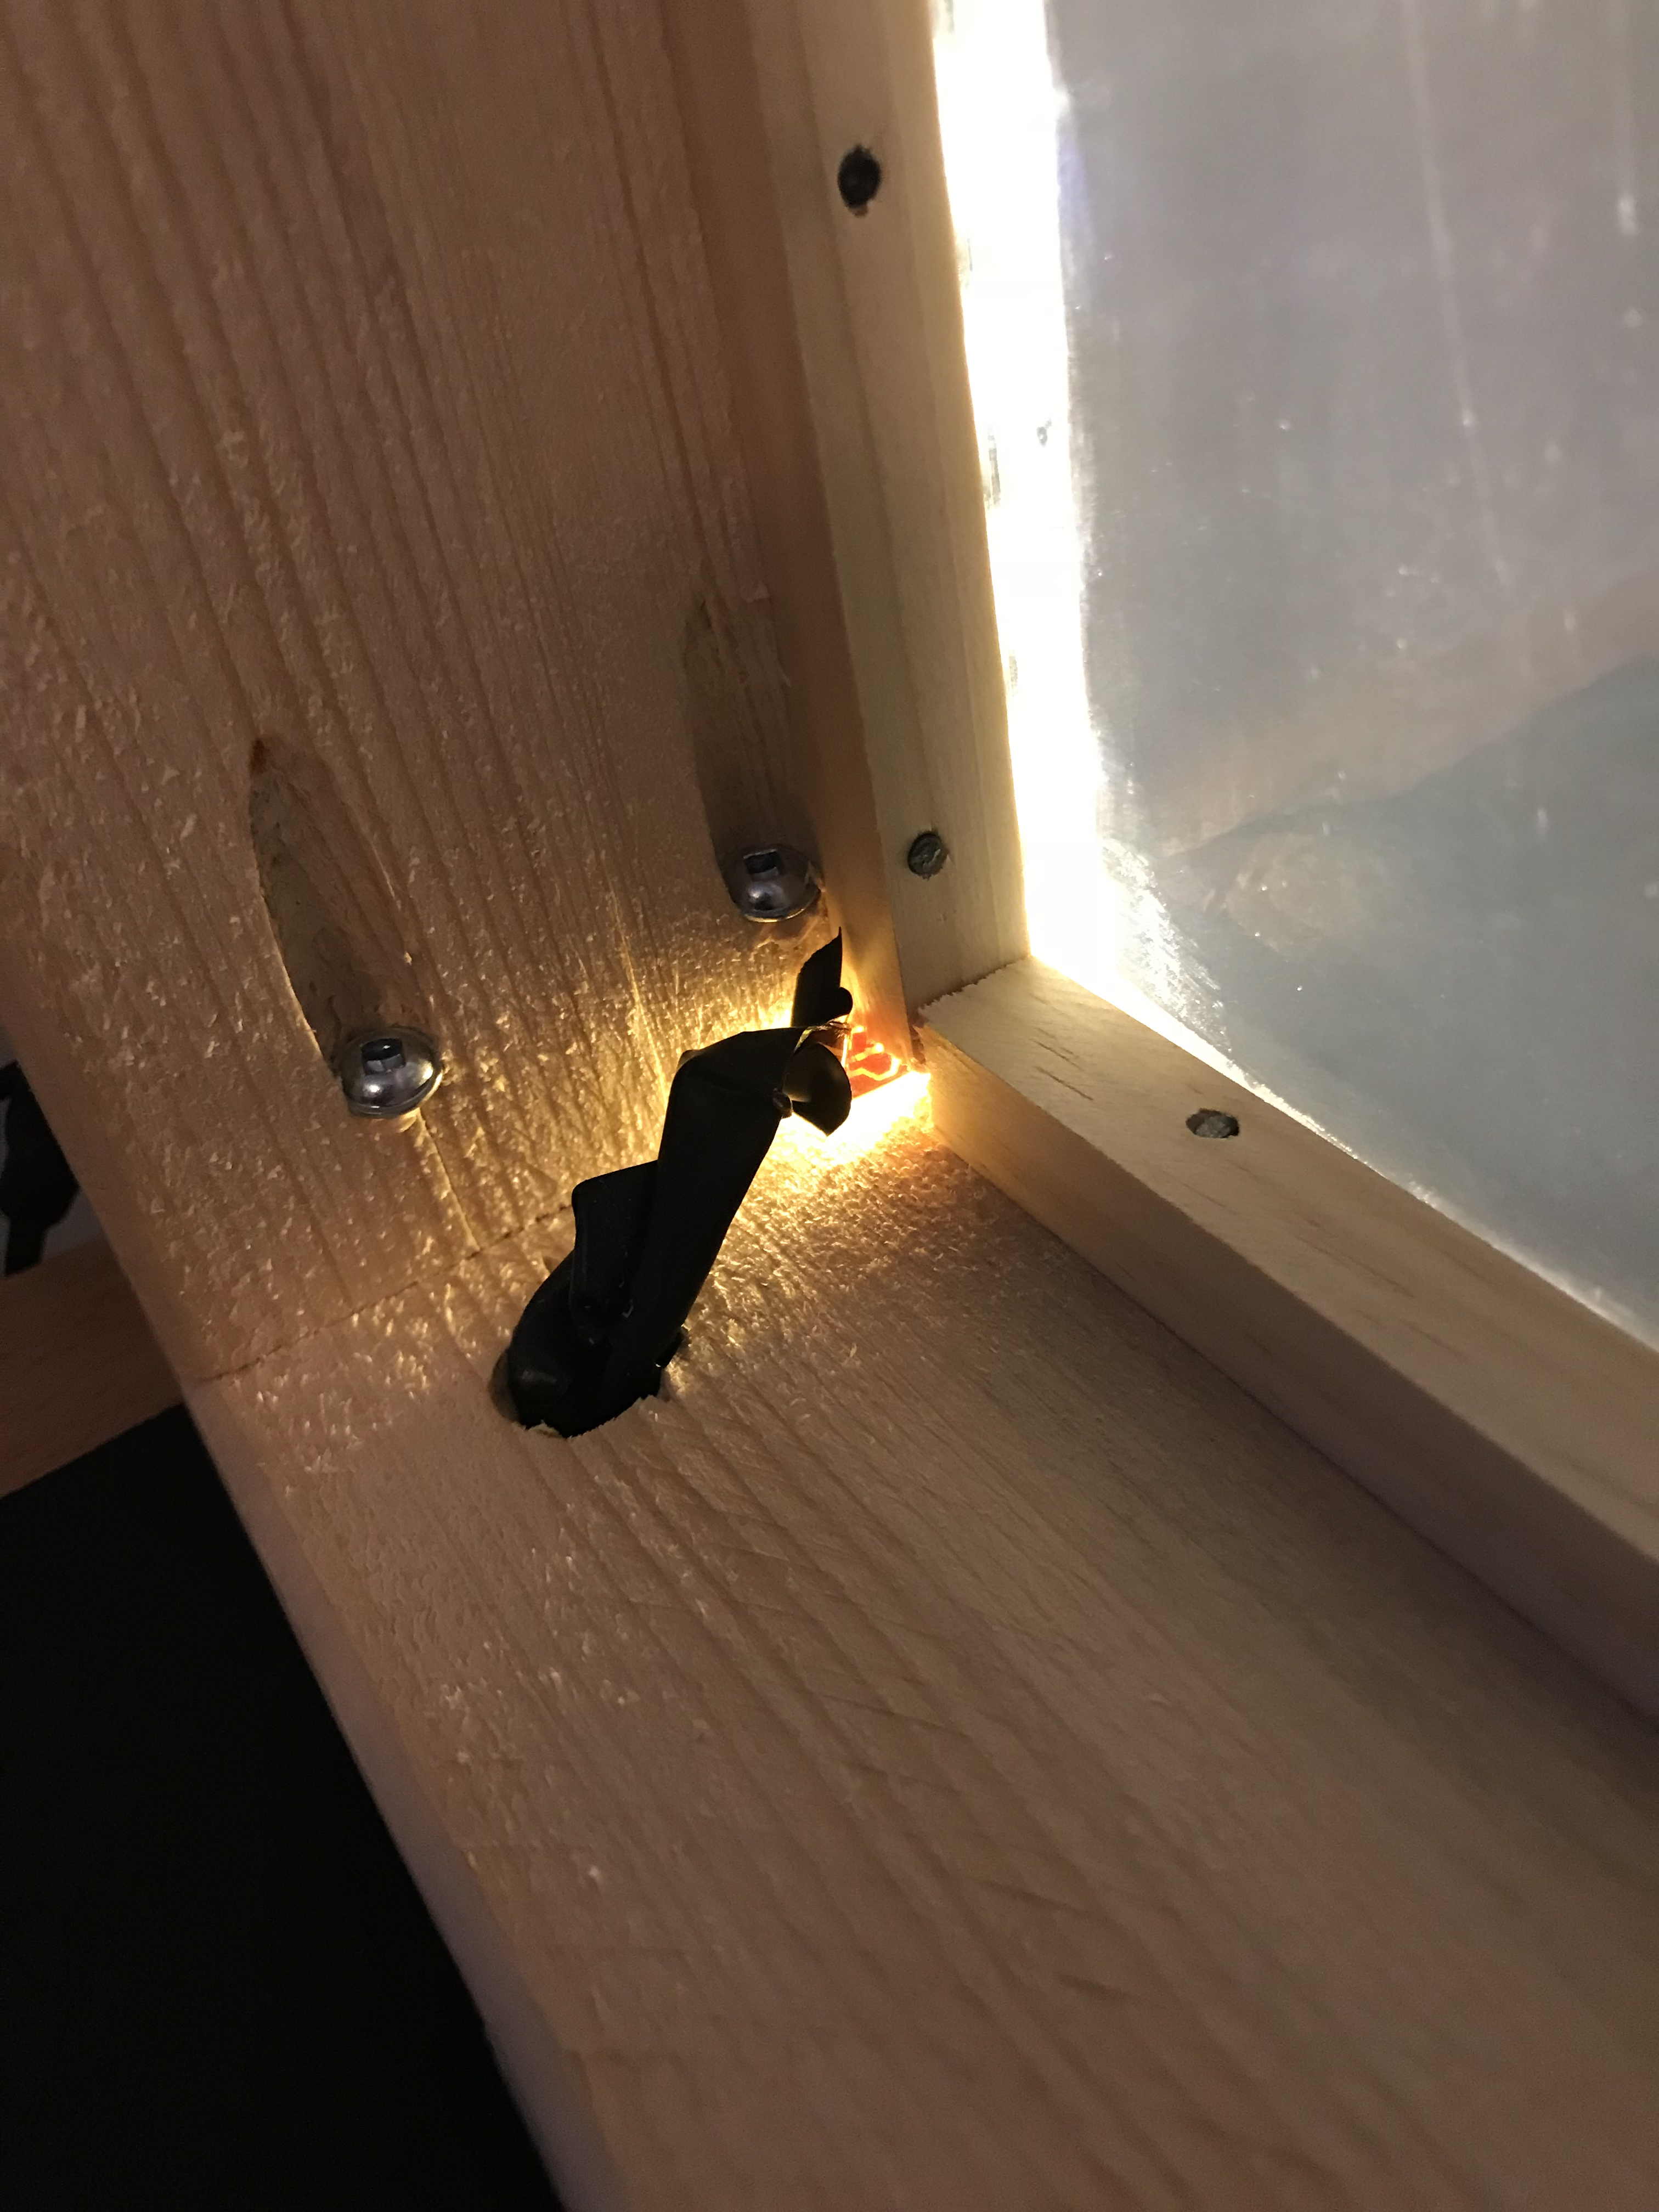
You may also notice above that the cord for the LED strip is going out the side of the box. I drilled a large hole in the side to allow the plug through so the box could sit flat.

With the shelf built, you can now mount the LED strip on the inside of one of the short sides. The LED strip I bought was made to be cut to length and had sticky tape on the back. It was pretty easy to just peel off and stick to the inside. Seemed secure enough! With that in place, you can now slide the plexiglass into the box as well. Like I mentioned in the parts list, buy the thickest plexiglass they have at that size, since the thin one will be too bouncy while writing. Mine was a bit of a tight fit, but taking it slow and just pushing in the right spot eventually got it to fall into place.

Finally, I wanted to make sure that the box had something dark on the bottom. I went with the “free” option here and just cut out a piece of cardboard to the size of the box and spray painted it black. Any dark fabric or paper or whatever you’ve got laying around would do.

That’s mostly it for the build! To top things off, I ran electrical tape around the edges of the box. I did this to try and help cut down on some of the light bleed, but I’m not sure if it actually helps. Either way, it holds the plexiglass in place too.

Webcam Insanity

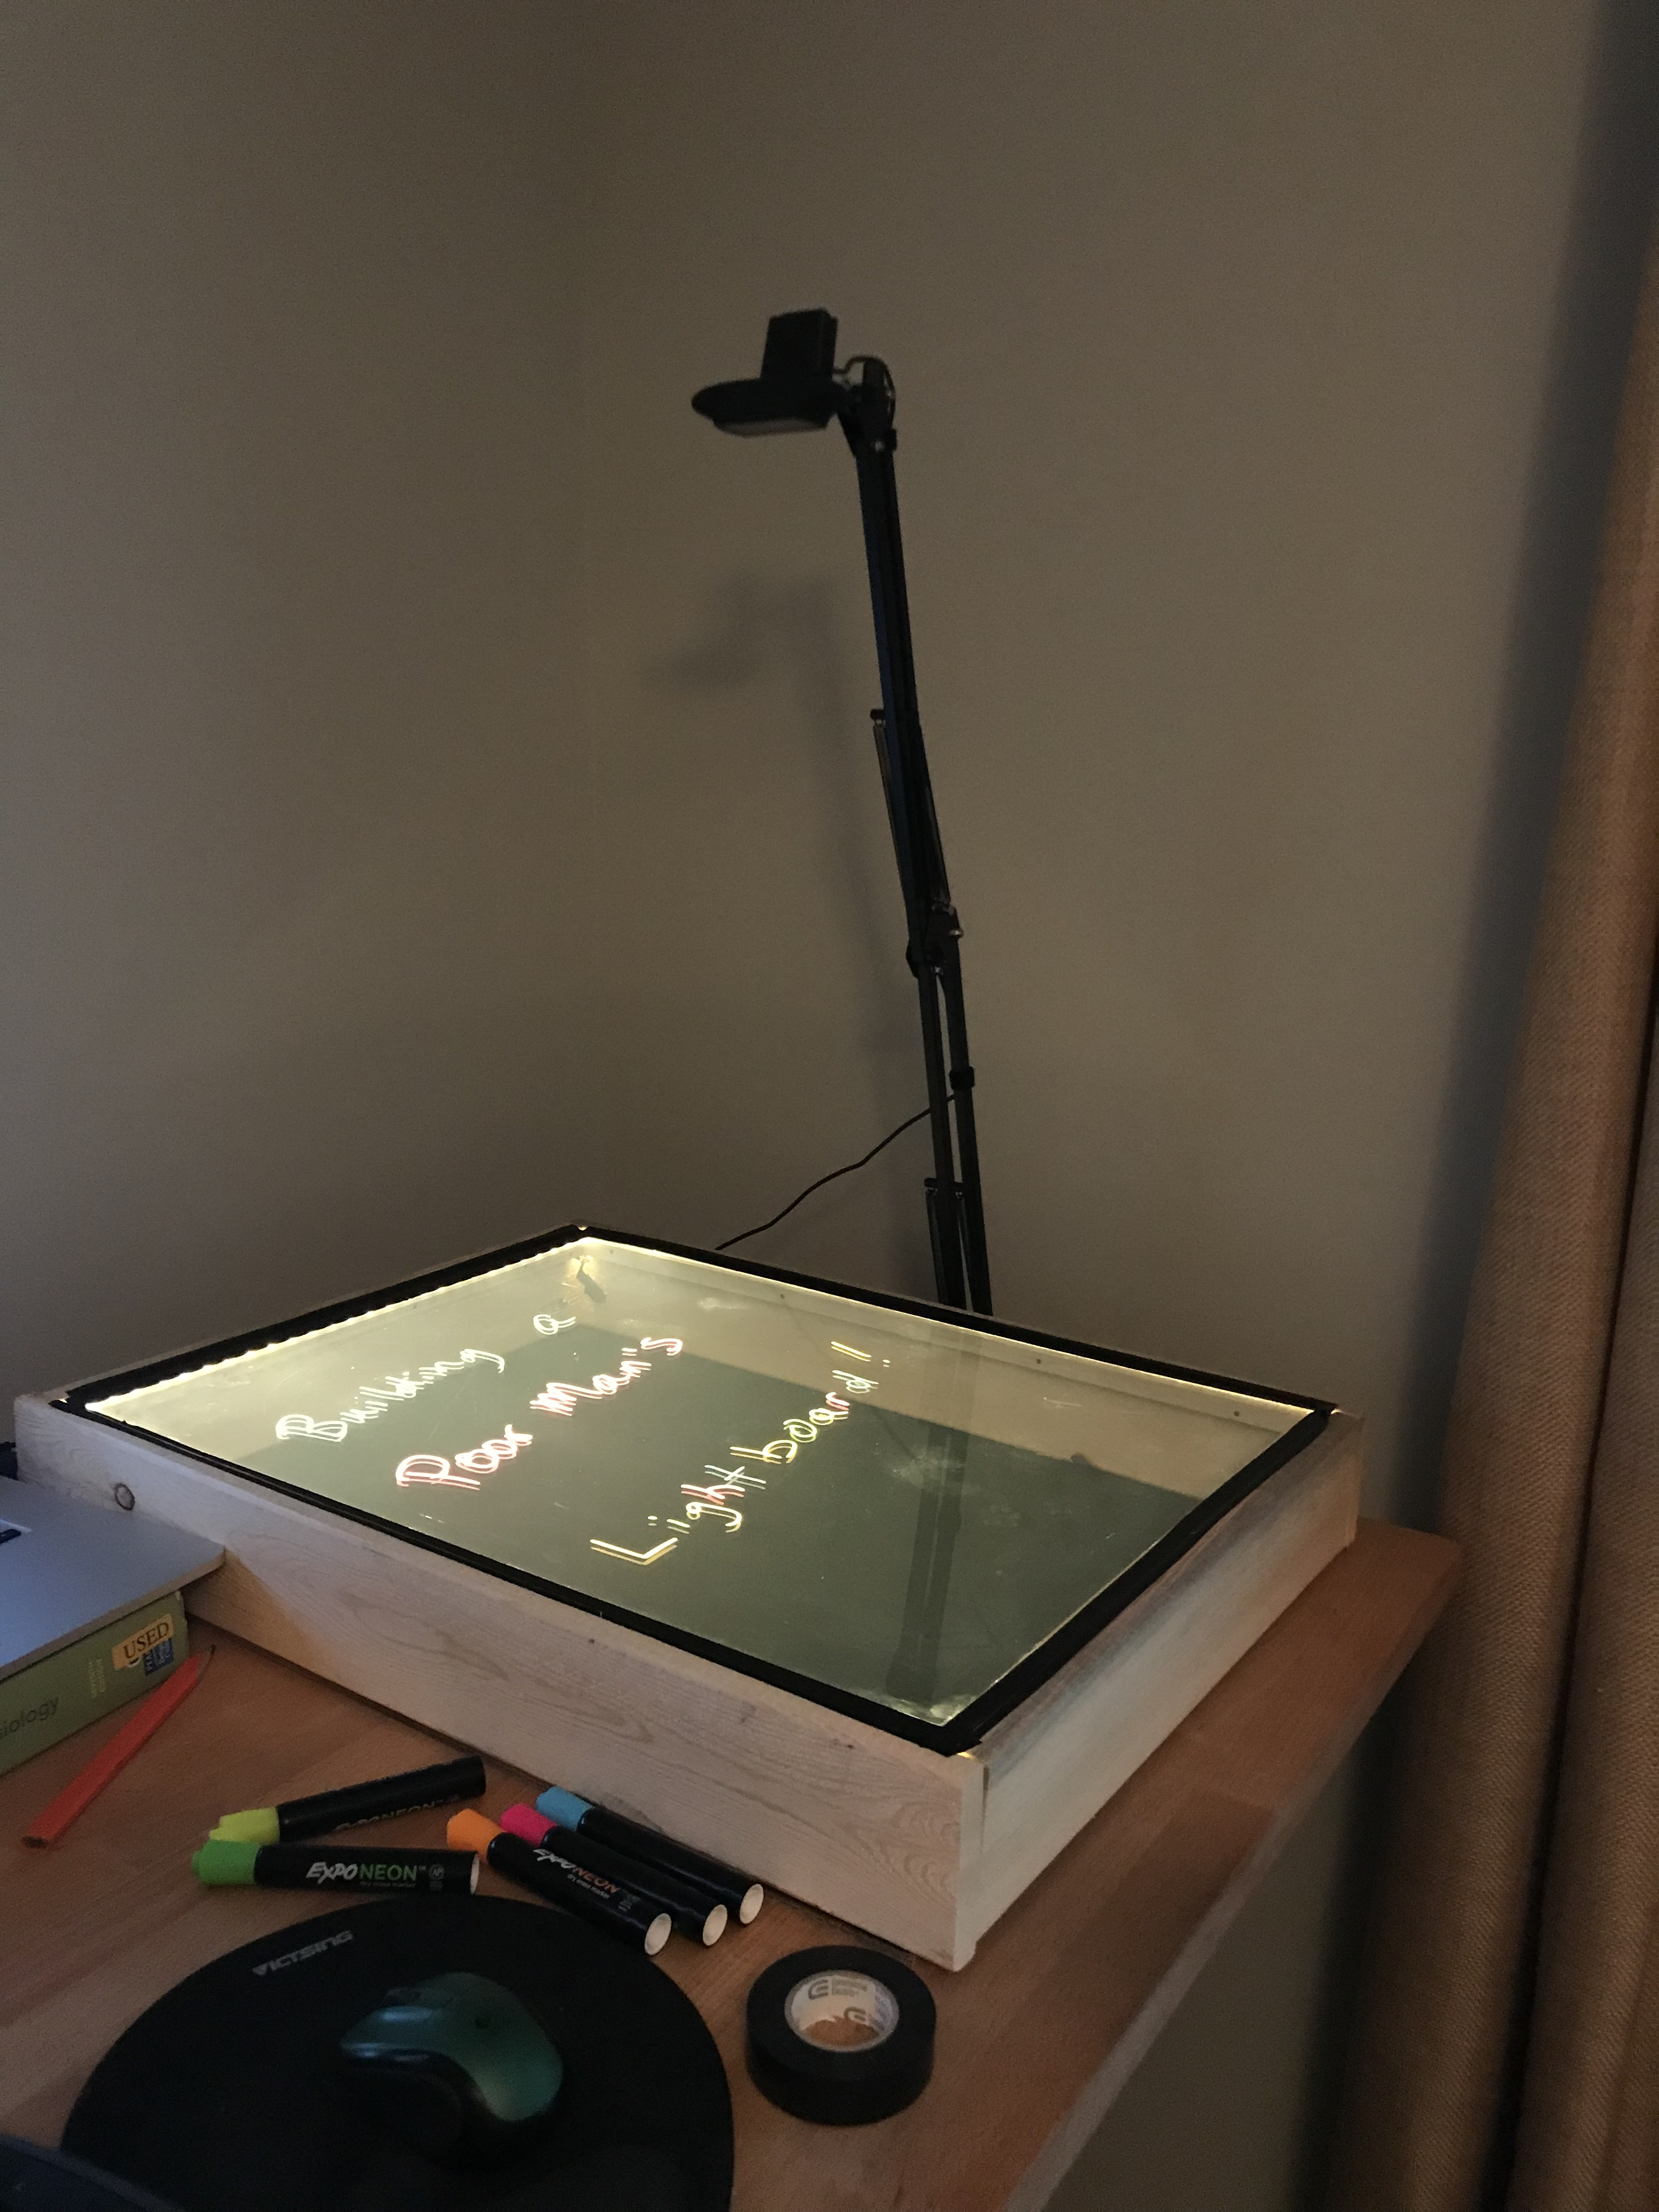
Now that we’ve got the box build, it’s time to get the webcam going. This was pretty straightforward, just attach the arm we bought to the desk and mount the webcam on top of it. Just need to make sure that the webcam is up high enough. I also found that mounting it on the side of my desk allowed for a pretty got field of view on the box. A pic probably does this the most justice:

With the webcam mounted, it was now time to try and get things to look right during a Zoom meeting since my primary goal here was to be able to whiteboard with co-workers. Mac didn’t make this easy. Seems like it’s pretty rare for folks to want to flip their webcam, do some more advanced color tweaks, and all that jazz. I wound up having to buy two apps to make this happen. I feel certain that if you’re using Linux (or maybe even Windows), this can probably be done easier as there seem to be better tools for changing settings.

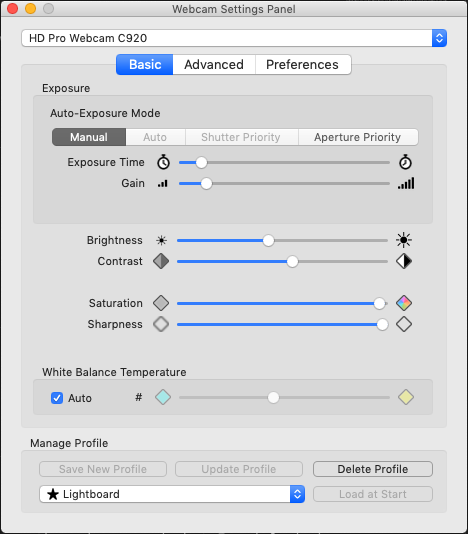
The first is called “Webcam Settings” in the Mac App Store. I feel like the settings for this will be dependent upon the webcam used, but I mainly had to disable auto-zoom, crank up the saturation, and increase the contrast a bit. I followed that by lowering the exposure. This seemed to get me a pretty dark image that gave a pretty decent picture of how a lightboard generally looks. The other nice thing about this app is there’s an opiton to write the settings to the webcam every second. This solves the problem of applications like Zoom which may try to tweak the brightness when you open the app. It’ll flip back to the proper settings quickly.

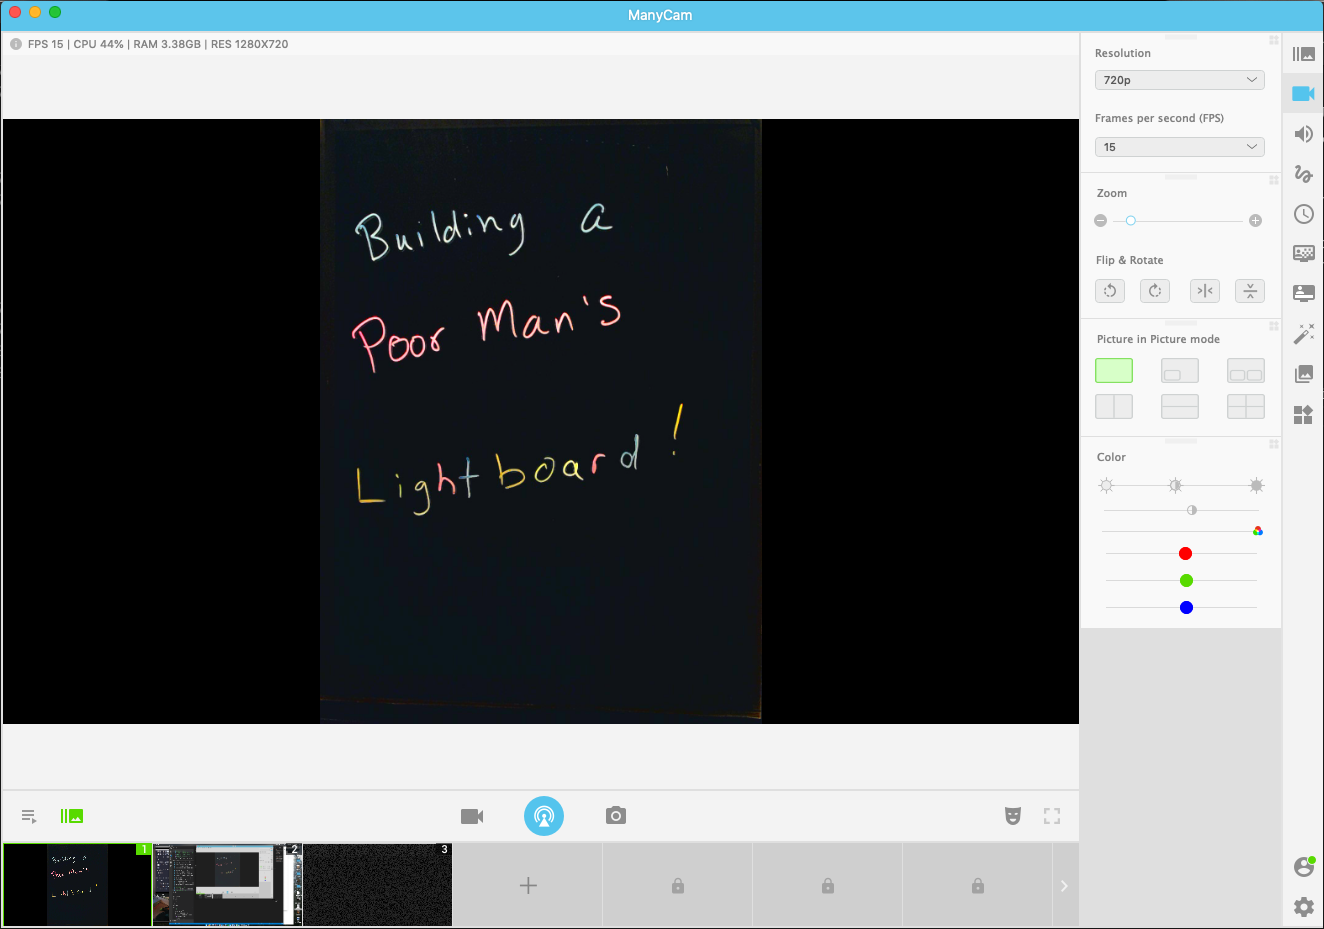
Next comes ManyCam. ManyCam basically performs the function of flipping the webcam picture sideways. Again, your usage of this may differ depending on how you mount the camera or It’s a pretty slick app that can do lots of other stuff as well, like cut between cameras or show your desktop. I imagine I’ll probably use that functionality as well. Once configured, ManyCam creates a “virtual webcam”, which you can select in Zoom. In ManyCam, I also cranked the saturation and lowered the brightness a bit more in addition to zooming in on the picture a bit. For some reason, this looked a bit cleaner than when I did the same in Webcam Settings, so having both paid off. Here’s what the main video screen looks like for me:

Wrap-Up

And that’s it! With ManyCam running, you just need to select the virtual webcam when sharing video in a Zoom meeting. Here’s an example of what it looks like:

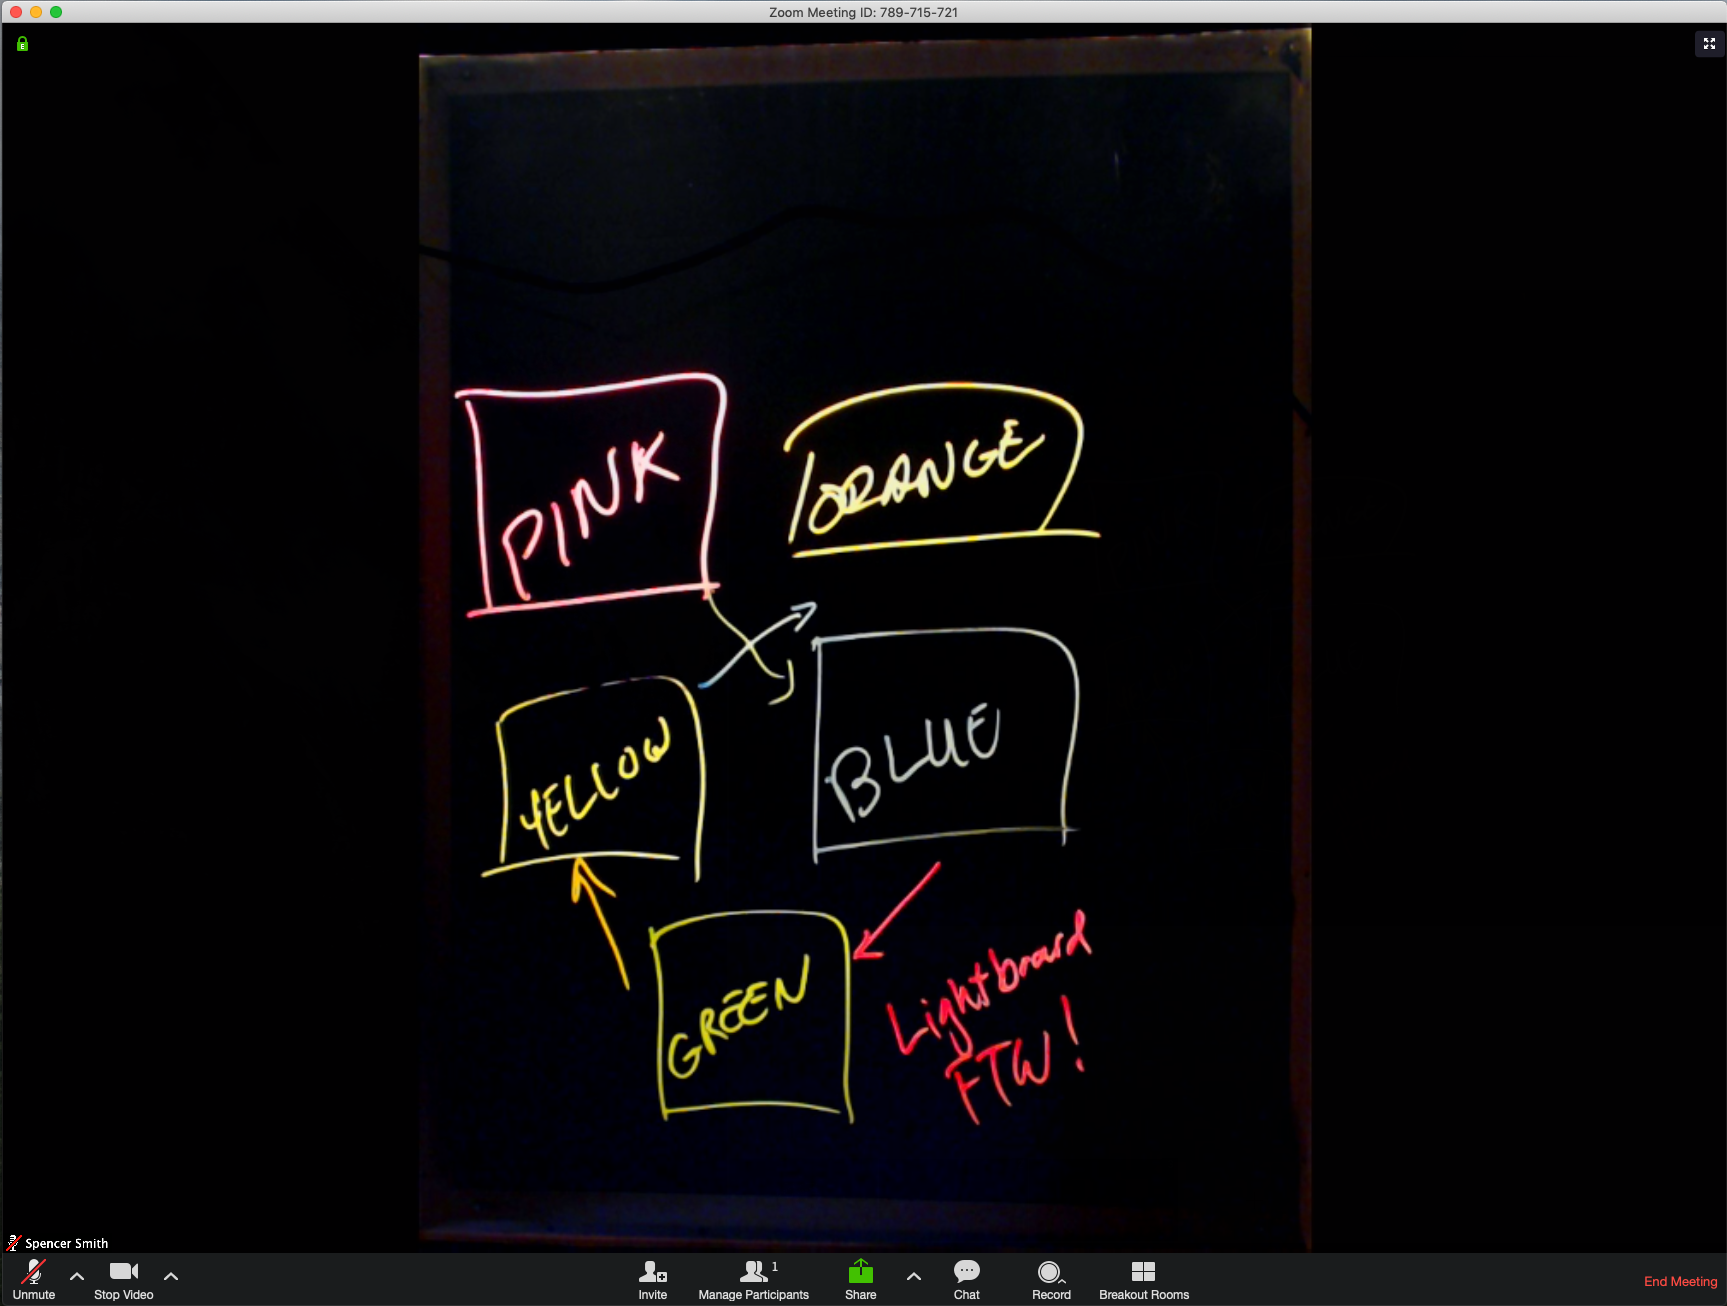
I’m pretty happy with how this turned out. I’m hoping that I’ll really get some use out of this as I have architecture discussions with my team. Thanks for checking this out!

##NOTE: This post is outdated and shows an incorrect way of creating exporters. You’d be better served to view this post instead.

Recently I’ve been using prometheus at work to monitor and alert on the status of our Kubernetes clusters, as well as services we have running in the cluster. One really nice thing about using prometheus is that Kubernetes already exposes a /metrics endpoint and it’s pretty simple to configure prometheus to scrape it. For other services, prometheus can even look for annotations on your pod definitions and begin scraping them automatically. However, not all software comes with snazzy prometheus endpoints built-in. As such, this post will go through the process of exposing your own endpoint and writing metrics out to it using golang.

The Basics

It’s important to learn a bit about the different pieces involved before we start stepping into the code. First, know that there’s already a golang SDK for prometheus which makes the process quite nice. You can find that in github here. An absolute high level of how prometheus does its thing is necessary as well. There’s quite a few ways to deploy Prometheus on Kubernetes (which we won’t deep dive on). We have been using the helm installation, which has been pretty straight forward. But once you’ve deployed it, it’s mostly just making sure that you’ve got your pods configured with the proper annotations so that Promtheus picks them up automatically. Here’s an example:

...
annotations:
  prometheus.io/scrape: "true"
  prometheus.io/port: "8080"
  prometheus.io/path: "/metrics" # this is the default already
...

Once these are added, Prometheus will automatically hit the /metrics endpoint and pull any info you expose there.

Finally, it helps to know a little bit about the different types of metrics in Prometheus. A great write-up is on the Prometheus site here. For today, we’ll be worrying about “counters”. It’s just a simple number value that always goes up. You’ll likely find yourself using “gauges” pretty quickly as well, since they’re effectively counters that go up or down.

The Code

Alright, let’s get some code down. First, we need a webserver. Golang does a great job of making this easy, but we’re also going to import the promhttp library since it’s necessary to handle the actual communication with prometheus.

  • Create a main.go file in the subdirectory of your choice. Paste the following contents:
package main

import (
  "net/http"

  log "github.com/Sirupsen/logrus"
  "github.com/prometheus/client_golang/prometheus/promhttp"
)

func main() {
  //This section will start the HTTP server and expose
  //any metrics on the /metrics endpoint.
  http.Handle("/metrics", promhttp.Handler())
  log.Info("Beginning to serve on port :8080")
  log.Fatal(http.ListenAndServe(":8080", nil))
}
  • Notice that there’s a couple of imported packages. You may wish to install dep or something similar in order to go get these. I just used dep init.
  • Once you’ve got the imports, this will actually function as expected right away! Issue go run main.go and issue curl 127.0.0.1:8080/metrics. You’ll notice a significant amount of metrics already. The reason you’ll see the metrics below is because the Prometheus package already exposes some basic info about the golang environment it’s running in automatically.
# HELP go_gc_duration_seconds A summary of the GC invocation durations.
# TYPE go_gc_duration_seconds summary
go_gc_duration_seconds{quantile="0"} 0
go_gc_duration_seconds{quantile="0.25"} 0
...
...
...
# HELP process_start_time_seconds Start time of the process since unix epoch in seconds.
# TYPE process_start_time_seconds gauge
process_start_time_seconds 1.51986054859e+09
# HELP process_virtual_memory_bytes Virtual memory size in bytes.
# TYPE process_virtual_memory_bytes gauge
process_virtual_memory_bytes 4.00805888e+08

It’s now time to add our own metric, but there’s a bit to understand about the flow of it as we go. At a high level what happens is that you implement a “collector”, which is an interface provided by the Prometheus client. This collector is registered with the Prometheus client when your exporter starts up and the metrics you scrape are exposed to the metrics endpoint automatically.

Let’s get it going:

  • Create a new file called collector.go in the same directory.
  • In the file, paste the following code. Notice that it’s heavily documented with what’s going on in the file.
package main

import (
	"github.com/prometheus/client_golang/prometheus"
)

//Define a struct for you collector that contains pointers
//to prometheus descriptors for each metric you wish to expose.
//Note you can also include fields of other types if they provide utility
//but we just won't be exposing them as metrics.
type fooCollector struct {
	fooMetric *prometheus.Desc
	barMetric *prometheus.Desc
}

//You must create a constructor for you collector that
//initializes every descriptor and returns a pointer to the collector
func newFooCollector() *fooCollector {
	return &fooCollector{
		fooMetric: prometheus.NewDesc("foo_metric",
			"Shows whether a foo has occurred in our cluster",
			nil, nil,
		),
		barMetric: prometheus.NewDesc("bar_metric",
			"Shows whether a bar has occurred in our cluster",
			nil, nil,
		),
	}
}

//Each and every collector must implement the Describe function.
//It essentially writes all descriptors to the prometheus desc channel.
func (collector *fooCollector) Describe(ch chan<- *prometheus.Desc) {

	//Update this section with the each metric you create for a given collector
	ch <- collector.fooMetric
	ch <- collector.barMetric
}

//Collect implements required collect function for all promehteus collectors
func (collector *fooCollector) Collect(ch chan<- prometheus.Metric) {

	//Implement logic here to determine proper metric value to return to prometheus
	//for each descriptor or call other functions that do so.
	var metricValue float64
	if 1 == 1 {
		metricValue = 1
	}

	//Write latest value for each metric in the prometheus metric channel.
	//Note that you can pass CounterValue, GaugeValue, or UntypedValue types here.
	ch <- prometheus.MustNewConstMetric(collector.fooMetric, prometheus.CounterValue, metricValue)
	ch <- prometheus.MustNewConstMetric(collector.barMetric, prometheus.CounterValue, metricValue)

}

Walking through the file above, you’ll notice that you must create an initializer, a “Describe” function, and a “Collect” function. These seem to be the bare minimum requirements. You’ll also notice that we’re creating two metrics, fooMetric and barMetric if you look in the fooCollector struct. The initializer does exactly what you’d expect, returns a pointer to the collector after adding some descriptions to fooMetric and barMetric. Describe simply writes those descriptions out to the channel that is passed in. Finally, Collect simply writes your desired metric values out to the channel that is passed in (simply 1 in our case).

  • Update your main.go to register”fooCollector” when starting up. The whole main.go should look like the following:
package main

import (
  "net/http"

  log "github.com/Sirupsen/logrus"
  "github.com/prometheus/client_golang/prometheus"
  "github.com/prometheus/client_golang/prometheus/promhttp"
)

func main() {

  //Create a new instance of the foocollector and 
  //register it with the prometheus client.
  foo := newFooCollector()
  prometheus.MustRegister(foo)

  //This section will start the HTTP server and expose
  //any metrics on the /metrics endpoint.
  http.Handle("/metrics", promhttp.Handler())
  log.Info("Beginning to serve on port :8080")
  log.Fatal(http.ListenAndServe(":8080", nil))
}
  • Now, we can run the file just like before and see our new metrics exposed! Hit the /metrics endpoint after starting your webserver with go run main.go collector.go.
$ curl 127.0.0.1:8080/metrics

# HELP bar_metric Shows whether a bar has occurred in our cluster
# TYPE bar_metric counter
bar_metric 1
# HELP foo_metric Shows whether a foo has occurred in our cluster
# TYPE foo_metric counter
foo_metric 1
...
...
...

That’s pretty much it. Really not that bad to implement from scratch, but of course and useful metrics will be more detailed than what we’ve done here. As far as rolling this out, you’d simply need to create a Docker image with your new Golang binary and deploy that image in a Kubernetes pod. Using the right annotations that we talked about earlier, your new metrics should be exposed automatically. Hit me up with any questions, but I won’t swear to be a pro at Go or Prometheus :)

Hey y’all. Wanted to document some of the stranger bits I’ve encountered while running Kubernetes with one of my clients. We’ve finally got some decent sized clusters running in their environment and they’re being heavily utilized by developers, as they push new or rewritten services into the cluster. Win! That said, we got some complaints about the network performance these guys were seeing. It sounded like intra-cluster communication was working well, but trying to connect to other systems outside of the cluster or things on the public internet were really slow. Like anywhere between 4-10 seconds to resolve the names. Uh oh. Here’s some of what we did to help work around that, as well as how we figured it out.

Basics

So we had traditionally just been deploying the official KubeDNS deployment that is part of the Kubernetes repo. Or, rather, we were using the one that Kargo deploys, which is just a copy of the former. We’ll still be using that as our basis. It’s also important to note that the pod that’s deployed is 3 containers: kubedns, dnsmasq, and a sidecar for health checking. The names of these seem to have changed very recently, but just know that the important ones are kubedns and dnsmasq.

The flow is basically this:

  • A request for resolution inside the cluster is directed to the kubedns service
  • The dnsmasq container is the first that receives the request
  • If the request is cluster.local, in-addr.arpa, or similar, it is forwarded to the kubedns container for resolution.
  • If it’s something else, dnsmasq container queries the upstream DNS that’s present in its /etc/resolv.conf file.

Logging

So, while all of the above seemed to be working, it was just slow. The first thing I tried to do was see if queries were making it to the dnsmasq container in a timely fashion. I dumped the logs with kubectl logs -f --tail 100 -c dnsmasq -n kube-system kubedns-xxxyy. I noticed quickly that there weren’t any logs of interest here:

dnsmasq[1]: started, version 2.76 cachesize 1000
dnsmasq[1]: compile time options: IPv6 GNU-getopt no-DBus no-i18n no-IDN DHCP DHCPv6 no-Lua TFTP no-conntrack ipset auth no-DNSSEC loop-detect inotify
dnsmasq[1]: using nameserver 127.0.0.1#10053
dnsmasq[1]: read /etc/hosts - 7 addresses

I needed to enable log-queries:

  • You can do this by editing the RC with kubectl edit rc -n kube-system kubedns.
  • Update the flags under the dnsmasq container to look like the following:
...
      - args:
        - --log-facility=-
        - --cache-size=1000
        - --no-resolv
        - --server=127.0.0.1#10053
        - --log-queries
...
  • Bounce the replicas with:
kubectl scale rc -n kube-system kubedns --replicas=0 && \
kubectl scale rc -n kube-system kubedns --replicas=1

Once the new pod is online you can then dump the logs again. You should see lots of requests flowing through, even on a small cluster.

WTF Is That?##

So now that I had some logs online, I started querying from inside of a pod. The first thing I ran was something like time nslookup kubedns.kube-system.svc.cluster.local to just simply look up something internal to the cluster. As soon as I did that, I saw a TON of queries and, while it eventually resolved, it was searching every. single. possible. name.

dnsmasq[1]: query[A] kubedns.kube-system.svc.cluster.local.kube-system.svc.cluster.local from 10.234.96.0
dnsmasq[1]: forwarded kubedns.kube-system.svc.cluster.local.kube-system.svc.cluster.local to 127.0.0.1
dnsmasq[1]: reply kubedns.kube-system.svc.cluster.local.kube-system.svc.cluster.local is NXDOMAIN
dnsmasq[1]: query[A] kubedns.kube-system.svc.cluster.local.svc.cluster.local from 10.234.96.0
dnsmasq[1]: forwarded kubedns.kube-system.svc.cluster.local.svc.cluster.local to 127.0.0.1
dnsmasq[1]: reply kubedns.kube-system.svc.cluster.local.svc.cluster.local is NXDOMAIN
dnsmasq[1]: query[A] kubedns.kube-system.svc.cluster.local.cluster.local from 10.234.96.0
dnsmasq[1]: forwarded kubedns.kube-system.svc.cluster.local.cluster.local to 127.0.0.1
dnsmasq[1]: reply kubedns.kube-system.svc.cluster.local.cluster.local is NXDOMAIN
dnsmasq[1]: query[A] kubedns.kube-system.svc.cluster.local.default.svc.cluster.local from 10.234.96.0
dnsmasq[1]: forwarded kubedns.kube-system.svc.cluster.local.default.svc.cluster.local to 127.0.0.1
dnsmasq[1]: reply kubedns.kube-system.svc.cluster.local.default.svc.cluster.local is NXDOMAIN
dnsmasq[1]: query[A] kubedns.kube-system.svc.cluster.local.svc.cluster.local from 10.234.96.0
dnsmasq[1]: forwarded kubedns.kube-system.svc.cluster.local.svc.cluster.local to 127.0.0.1
dnsmasq[1]: reply kubedns.kube-system.svc.cluster.local.svc.cluster.local is NXDOMAIN
dnsmasq[1]: query[A] kubedns.kube-system.svc.cluster.local.us-west-2.compute.internal from 10.234.96.0
dnsmasq[1]: forwarded kubedns.kube-system.svc.cluster.local.us-west-2.compute.internal to 127.0.0.1
dnsmasq[1]: query[A] kubedns.kube-system.svc.cluster.local.compute.internal from 10.234.96.0
dnsmasq[1]: forwarded kubedns.kube-system.svc.cluster.local.compute.internal to 127.0.0.1
dnsmasq[1]: reply kubedns.kube-system.svc.cluster.local.compute.internal is NXDOMAIN
dnsmasq[1]: query[A] kubedns.kube-system.svc.cluster.local from 10.234.96.0
dnsmasq[1]: forwarded kubedns.kube-system.svc.cluster.local to 127.0.0.1
dnsmasq[1]: reply kubedns.kube-system.svc.cluster.local is 10.233.0.3

Once I did this, I tried an exteral name to see similar results and a super slow lookup time:

dnsmasq[1]: query[A] espn.com.kube-system.svc.cluster.local from 10.234.96.0
dnsmasq[1]: forwarded espn.com.kube-system.svc.cluster.local to 127.0.0.1
dnsmasq[1]: reply espn.com.kube-system.svc.cluster.local is NXDOMAIN
dnsmasq[1]: query[A] espn.com.svc.cluster.local from 10.234.96.0
dnsmasq[1]: forwarded espn.com.svc.cluster.local to 127.0.0.1
dnsmasq[1]: reply espn.com.svc.cluster.local is NXDOMAIN
dnsmasq[1]: query[A] espn.com.cluster.local from 10.234.96.0
dnsmasq[1]: forwarded espn.com.cluster.local to 127.0.0.1
dnsmasq[1]: reply espn.com.cluster.local is NXDOMAIN
dnsmasq[1]: query[A] espn.com.default.svc.cluster.local from 10.234.96.0
dnsmasq[1]: forwarded espn.com.default.svc.cluster.local to 127.0.0.1
dnsmasq[1]: reply espn.com.default.svc.cluster.local is NXDOMAIN
dnsmasq[1]: query[A] espn.com.svc.cluster.local from 10.234.96.0
dnsmasq[1]: forwarded espn.com.svc.cluster.local to 127.0.0.1
dnsmasq[1]: reply espn.com.svc.cluster.local is NXDOMAIN
dnsmasq[1]: query[A] espn.com.us-west-2.compute.internal from 10.234.96.0
dnsmasq[1]: forwarded espn.com.us-west-2.compute.internal to 127.0.0.1
dnsmasq[1]: query[A] espn.com.compute.internal from 10.234.96.0
dnsmasq[1]: forwarded espn.com.compute.internal to 127.0.0.1
dnsmasq[1]: reply espn.com.compute.internal is NXDOMAIN
dnsmasq[1]: query[A] espn.com from 10.234.96.0
dnsmasq[1]: forwarded espn.com to 127.0.0.1
dnsmasq[1]: reply espn.com is 199.181.132.250

What’s happening? It’s the ndots. KubeDNS is hard coded with an ndots value of 5. This means that any request for resolution that contains fewer than 5 dots will cycle through all of the search domains as well in an attempt to resolve. You can see both of these by dumping the /etc/resolv.conf file from the dnsmasq container:

$ kubectl exec -ti kubedns-mg3tt -n kube-system -c dnsmasq cat /etc/resolv.conf
search default.svc.cluster.local svc.cluster.local us-west-2.compute.internal compute.internal
nameserver wwww.xxx.yyy.zzzz
options attempts:2
options ndots:5

It turns out that this is kind of a known issue within KubeDNS if your google-fu is strong enough to find it. Here’s a couple of good links for some context:

  • https://github.com/kubernetes/kubernetes/issues/33554
  • https://github.com/kubernetes/kubernetes/issues/14051
  • https://github.com/kubernetes/kubernetes/issues/27679

Duct Tape It!

Okay, so from what I was reading, it looked like there wasn’t a good consensus on how to fix this, even though an ndots of 3 would have mostly resolved this issue for us. Or at least sped things up enough that we would have been okay with it. And yet, here we are. So we’ve got to speed this up somehow.

I started reading a bit more about dnsmasq and how we could avoid searching for all of those domain names when we know they don’t exist. Enter the address flag. This is a dnsmasq flag that you can use to return a defined IP to any request that matches the listed domains. But, if you don’t provide the IP it simply returns an NXDOMAIN very quickly and thus doesn’t bother forwarding requests up to kubedns or your upstream nameserver. This wound up being the biggest part of our fix. The only real pain in the butt is that you have to list all the domains you want to catch. We gave it a good shot, but I’m sure there’s more that could be listed. A minor extra is the --no-negcache flag. Because we’re sending so many NXDOMAIN responses around, we don’t want to cache them because it’ll eat our whole cache.

The other big part to consider is the server flag. This one allows us to specify for a given domain which DNS server should be queried. This seems to actually have been added into the master branch of Kubernetes now as well.

So here’s how to fix it:

  • Edit the dnsmasq args to look like the following:
    - args:
      - --log-facility=-
      - --cache-size=10000
      - --no-resolv
      - --server=/cluster.local/127.0.0.1#10053
      - --server=/in-addr.arpa/127.0.0.1#10053
      - --server=/ip6.arpa/127.0.0.1#10053
      - --server=www.xxx.yyy.zzz
      - --log-queries
      - --no-negcache
      - --address=/org.cluster.local/org.svc.cluster.local/org.default.svc.cluster.local/com.cluster.local/com.svc.cluster.local/com.default.svc.cluster.local/net.cluster.local/net.svc.cluster.local/net.default.svc.cluster.local/com.compute.internal/net.compute.internal/com.us-west-2.compute.internal/net.us-west-2.compute.internal/svc.svc.cluster.local/
  • You may find that you want to add more domains as they are relevant to you. We’ve got some internal domains in the address block that aren’t listed here.
  • Notice the last server flag. It should point to your upstream DNS server. You can also supply several of these flags if necessary.
  • Also note that you may not need to worry about the compute.internal domains unless you’re in AWS.
  • Bounce the replicas again:
kubectl scale rc -n kube-system kubedns --replicas=0 && \
kubectl scale rc -n kube-system kubedns --replicas=1

That’s it! Hope this helps someone. It really sped up the request time for us. All requests respond in fractions of a second now it seems. I fought with this for a while, but at least had a chance to learn a bit more about how DNS works both inside and outside of Kubernetes.

Since the release of Docker 1.12, there’s a new Swarm mode that is baked into the Docker engine. I wanted to spend some time, after months of Kubernetes-only work, to check out how Swarm was doing things and to see how easy it was to get started. Building a quick cluster on your laptop or on a single provider seemed to be straight forward, but I couldn’t readily find a no nonsense way to spin one up across multiple clouds. So, you know, I went ahead and built one.

Today, we’ll walk through how you can create a multi-cloud Swarm on AWS and GCE. We will use Terraform and Ansible to complete the bootstrap process, which is surprisingly straightforward. You can go directly to the Github repo where I stashed the code by clicking here.

I’ll give an early preface and say that I’ve only used this for some testing and learning experience. It’s in no way prod. ready or as robust as it should be to accept lots of different configurations.

Outline

The deployment of our cluster will occur in the following order:

  • AWS infrastructure is provisioned (security groups and instances)
  • GCE infrastructure is provisioned (firewall rules and instances)
  • An Ansible inventory file is created in the current working directory
  • Docker is installed and Swarm is initialized

Terraform Scripts

In order to create our infrastructure, we want to create three terraform scripts and a variable file. This will provide all of the necessary information that Terraform needs to do it’s thing.

  • Create four files: touch 00-aws-infra.tf 01-gce-infra.tf 02-create-inv.tf variables.tf
  • Open variables.tf for editing. We’ll populate this file with all of the configurable options that we will use for each cloud, as well as some general info that the instances have in common, regardless of cloud. Populate the file with the following:
##General vars
variable "ssh_user" {
  default = "ubuntu"
}
variable "public_key_path" {
  default = "/Users/spencer/.ssh/id_rsa.pub"
}
variable "private_key_path" {
  default = "/Users/spencer/.ssh/id_rsa"
}
##AWS Specific Vars
variable "aws_worker_count" {
  default = 1
}
variable "aws_key_name" {
  default = "spencer-key"
}
variable "aws_instance_size" {
  default = "t2.micro"
}
variable "aws_region" {
  default = "us-west-2"
}
##GCE Specific Vars
variable "gce_worker_count" {
  default = 1
}
variable "gce_creds_path" {
  default = "/Users/spencer/gce-creds.json"
}
variable "gce_project" {
  default = "test-project"
}
variable "gce_region" {
  default = "us-central1"
}
variable "gce_instance_size" {
  default = "n1-standard-1"
}
  • You can update these defaults if you desire, but also know that you can override these at runtime with the -var flag to terraform. See here for details.

  • Now that we’ve got the variables we need, let’s work on creating our AWS infrastructure. Open 00-aws-infra.tf and put in the following:

##Amazon Infrastructure
provider "aws" {
  region = "${var.aws_region}"
}

##Create swarm security group
resource "aws_security_group" "swarm_sg" {
  name        = "swarm_sg"
  description = "Allow all inbound traffic necessary for Swarm"
  ingress {
    from_port   = 22
    to_port     = 22
    protocol    = "tcp"
    cidr_blocks = ["0.0.0.0/0"]
  }
  ingress {
    from_port   = 2377
    to_port     = 2377
    protocol    = "tcp"
    cidr_blocks = ["0.0.0.0/0"]
  }
  ingress {
    from_port   = 7946
    to_port     = 7946
    protocol    = "tcp"
    cidr_blocks = ["0.0.0.0/0"]
  }
  ingress {
    from_port   = 7946
    to_port     = 7946
    protocol    = "udp"
    cidr_blocks = ["0.0.0.0/0"]
  }
  ingress {
    from_port   = 4789
    to_port     = 4789
    protocol    = "tcp"
    cidr_blocks = ["0.0.0.0/0"]
  }
  egress {
    from_port = 0
    to_port   = 0
    protocol  = "-1"
    cidr_blocks = [
      "0.0.0.0/0",
    ]
  }
  tags {
    Name = "swarm_sg"
  }
}

##Find latest Ubuntu 16.04 AMI
data "aws_ami" "ubuntu" {
  most_recent = true
  filter {
    name   = "name"
    values = ["ubuntu/images/hvm-ssd/ubuntu-xenial-16.04-amd64-server-*"]
  }
  filter {
    name   = "virtualization-type"
    values = ["hvm"]
  }
  owners = ["099720109477"] # Canonical
}

##Create Swarm Master Instance
resource "aws_instance" "swarm-master" {
  depends_on             = ["aws_security_group.swarm_sg"]
  ami                    = "${data.aws_ami.ubuntu.id}"
  instance_type          = "${var.aws_instance_size}"
  vpc_security_group_ids = ["${aws_security_group.swarm_sg.id}"]
  key_name               = "${var.aws_key_name}"
  tags {
    Name = "swarm-master"
  }
}

##Create AWS Swarm Workers
resource "aws_instance" "aws-swarm-members" {
  depends_on             = ["aws_security_group.swarm_sg"]
  ami                    = "${data.aws_ami.ubuntu.id}"
  instance_type          = "${var.aws_instance_size}"
  vpc_security_group_ids = ["${aws_security_group.swarm_sg.id}"]
  key_name               = "${var.aws_key_name}"
  count                  = "${var.aws_worker_count}"
  tags {
    Name = "swarm-member-${count.index}"
  }
}

Walking through this file, we can see a few things happen. If you’ve seen Terraform scripts before it’s pretty straight forward.

  • First, we simply configure a bit of info to tell Terraform to talk to our desired region that’s specified in the variables file.
  • Next, we create a security group called swarm_sg. This security group allows ingress from all of the ports listed here.
  • Finally, we’ll create all of the nodes that we plan to use in AWS. We’ll create the master instance first, simply because it’s tagged differently, then we’ll create the workers. Notice the use of ${var... everywhere. This is how variables are passed from the vars file into the desired configuration of our nodes.

It’s now time to create our GCE infrastructure.

  • Open 01-gce-infra.tf and paste the following:
##Google Infrastructure
provider "google" {
  credentials = "${file("${var.gce_creds_path}")}"
  project     = "${var.gce_project}"
  region      = "${var.gce_region}"
}

##Create Swarm Firewall Rules
resource "google_compute_firewall" "swarm_sg" {
  name    = "swarm-sg"
  network = "default"

  allow {
    protocol = "udp"
    ports    = ["7946"]
  }

  allow {
    protocol = "tcp"
    ports    = ["22", "2377", "7946", "4789"]
  }
}

##Create GCE Swarm Members
resource "google_compute_instance" "gce-swarm-members" {
  depends_on   = ["google_compute_firewall.swarm_sg"]
  name         = "swarm-member-${count.index}"
  machine_type = "${var.gce_instance_size}"
  zone         = "${var.gce_region}-a"
  count        = "${var.gce_worker_count}"

  disk {
    image = "ubuntu-os-cloud/ubuntu-1604-lts"
  }

  disk {
    type    = "local-ssd"
    scratch = true
  }

  network_interface {
    network       = "default"
    access_config = {}
  }

  metadata {
    ssh-keys = "ubuntu:${file("${var.public_key_path}")}"
  }
}

Taking a read through this file, you’ll notice we’re essentially doing the same thing we did with AWS:

  • Configure some basic info to connect to GCE.
  • Create firewall rules in the default network to allow ingresses for Swarm.
  • Create the Swarm members in GCE.

We’re almost done with Terraform! The last bit is we need to take the infrastructure that gets created and create an inventory file that Ansible can use to provision the actual Docker bits.

  • Populate 02-create-inv.tf:
resource "null_resource" "ansible-provision" {
  depends_on = ["aws_instance.swarm-master", "aws_instance.aws-swarm-members", "google_compute_instance.gce-swarm-members"]

  provisioner "local-exec" {
    command = "echo \"[swarm-master]\" > swarm-inventory"
  }

  provisioner "local-exec" {
    command = "echo \"${format("%s ansible_ssh_user=%s", aws_instance.swarm-master.0.public_ip, var.ssh_user)}\" >> swarm-inventory"
  }

  provisioner "local-exec" {
    command = "echo \"[swarm-nodes]\" >> swarm-inventory"
  }

  provisioner "local-exec" {
    command = "echo \"${join("\n",formatlist("%s ansible_ssh_user=%s", aws_instance.aws-swarm-members.*.public_ip, var.ssh_user))}\" >> swarm-inventory"
  }

  provisioner "local-exec" {
    command = "echo \"${join("\n",formatlist("%s ansible_ssh_user=%s", google_compute_instance.gce-swarm-members.*.network_interface.0.access_config.0.assigned_nat_ip, var.ssh_user))}\" >> swarm-inventory"
  }
}
 

This file simply tells Terraform, after all infrastructure has been created, to drop a file locally called swarm-inventory. The file that’s dropped should look like (real IPs redacted):

[swarm-master]
aaa.bbb.ccc.ddd ansible_ssh_user=ubuntu
[swarm-nodes]
eee.fff.ggg.hhh ansible_ssh_user=ubuntu
iii.jjj.kkk.lll ansible_ssh_user=ubuntu

Ansible Time!

Okay, now that we’ve got the Terraform bits ready to deploy the infrastructure, we need to be able to actually bootstrap the cluster once the nodes are online. We’ll create two files here: swarm.yml and swarm-destroy.yml.

  • Create swarm.yml with:
- name: Install Ansible Prereqs
  hosts: swarm-master:swarm-nodes
  gather_facts: no
  tasks:
    - raw: "apt-get update && DEBIAN_FRONTEND=noninteractive apt-get install -y python-minimal python-pip"

- name: Install Docker Prereqs
  hosts: swarm-master:swarm-nodes
  gather_facts: yes
  tasks:
    - package:
        name: "{{item}}"
        state: latest
      with_items:
        - apt-transport-https
        - ca-certificates
        - curl
        - software-properties-common
    - apt_key:
        url: "https://download.docker.com/linux/ubuntu/gpg"
        state: present
    - apt_repository:
        repo: "deb [arch=amd64] https://download.docker.com/linux/ubuntu xenial stable"
        state: present

- name: Install Docker
  hosts: swarm-master:swarm-nodes
  gather_facts: yes
  tasks:
    - package:
        name: "docker-ce"
        state: latest
    - user: 
        name: "{{ ansible_ssh_user }}"
        groups: docker
        append: yes

- name: Initialize Swarm Master
  hosts: swarm-master
  gather_facts: yes
  tasks:
    - command: "docker swarm init --advertise-addr {{inventory_hostname}}"
    - command: "docker swarm join-token -q worker"
      register: swarm_token
    - set_fact: swarmtoken="{{swarm_token.stdout}}"
  
- name: Join Swarm Nodes
  hosts: swarm-nodes
  gather_facts: yes
  tasks:
  - command: "docker swarm join --advertise-addr {{inventory_hostname}} --token {{hostvars[groups['swarm-master'][0]].swarmtoken}} {{hostvars[groups['swarm-master'][0]].inventory_hostname}}:2377"

This Ansible playbook does a few things:

  • Bootstraps all nodes with the necessary packages for Ansible to run properly.
  • Installs Docker prerequisites and then installs Docker.
  • On the master, initializes the swarm and grabs the key necessary to join.
  • On the nodes, simply joins the swarm.

Now, that’s really all we need. But while we’re here, let’s make sure we can tear our Swarm down as well.

  • Create swarm-destroy.yml:
- name: Leave Swarm
  hosts: swarm-master:swarm-nodes
  gather_facts: yes
  tasks:
    - command: "docker swarm leave --force"

That one’s really easy. It really just goes to each node and tells it to leave the Swarm, no questions asked.

Create Swarm

Okay, now that we’ve got all the bits in place, let’s create our swarm.

  • First source AWS API keys with source /path/to/awscreds.sh or export ....
  • Create the infrastructure with terraform apply. Keep in mind that you may also want to pass in the -var flag to override defaults.
  • Once built, issue cat swarm-inventory to ensure master and workers are populated.
  • Bootstrap the Swarm cluster with ANSIBLE_HOST_KEY_CHECKING=False ansible-playbook -b -i swarm-inventory swarm.yml.

In the just a couple of minutes, these steps should have been completed successfully. If all looks like it went okay, SSH into the master node.

  • Issue docker node ls and view all the nodes in the Swarm. You’ll notice different hostnames between AWS and GCE instances:
ubuntu@ip-172-31-5-8:~$ docker node ls
ID                           HOSTNAME         STATUS  AVAILABILITY  MANAGER STATUS
mei9ysylvokq6foczu7ygwso6 *  ip-172-31-5-8    Ready   Active        Leader
tzsdybhx5f9c8qv2z55ry2me4    swarm-member-0   Ready   Active
vzxbjpus3t8ufm0j0z7rmzn18    ip-172-31-6-146  Ready   Active

Test It Out

Now that we’ve got our Swarm up, let’s create a scaled service and we’ll see it show up on different environments.

  • Issue docker service create --replicas 5 --name helloworld alpine ping google.com on the master.
  • Find where the pods are scheduled with docker service ps helloworld:
ubuntu@ip-172-31-5-8:~$ docker service ps helloworld
ID            NAME          IMAGE          NODE             DESIRED STATE  CURRENT STATE              ERROR  PORTS
6ifn97x0lcor  helloworld.1  alpine:latest  swarm-member-0   Running        Running about an hour ago
fmfgkurl99j5  helloworld.2  alpine:latest  swarm-member-0   Running        Running about an hour ago
2et88afaxfky  helloworld.3  alpine:latest  ip-172-31-6-146  Running        Running about an hour ago
jbobdjkk062h  helloworld.4  alpine:latest  ip-172-31-5-8    Running        Running about an hour ago
j9nkx5lqr82x  helloworld.5  alpine:latest  ip-172-31-5-8    Running        Running about an hour ago
  • SSH into the GCE worker and find the containers running there with docker ps.
  • Show that the containers are pinging Google as expected with docker logs <CONTAINER_ID>
  • Do the same with the AWS nodes.

Teardown

Once we’re done with our test cluster it’s time to trash it.

  • You can tear down just the Swarm, while leaving the infrastructure with ANSIBLE_HOST_KEY_CHECKING=False ansible-playbook -b -i swarm-inventory swarm-destroy.yml
  • Tear down all the things with a simple terraform destroy

That’s it! I was happy to get a cross-cloud Swarm running pretty quickly. Over the next few weeks, I’ll probably come back to revisit my Swarm deployment and make sure some of the more interesting things are possible, like creating networks and scheduling webservers. Stay tuned!